

Security can reduce expected losses and may support lower insurance premiums, but a premium reduction is not automatic, and security measures do not eliminate liability. When measuring the ROI of corporate security programs, compare investment costs with risk-adjusted losses avoided and recoveries, then account for documented insurance effects and other business outcomes. The clearest case shows how controls change the organization’s exposure, rather than relying on the existence of a security budget.
It is reasonable to expect a security program to demonstrate financial value, even when its most important success is preventing an incident that never becomes visible. This article explains how to frame the calculation, assess direct and indirect costs, and weigh avoided losses, recoveries, insurance effects, liability exposure, and operational priorities. It also shows how to present results so decision-makers understand what the investment protects and where its value remains uncertain.
Key Takeaways
- Assess security value by comparing investment costs with risk-adjusted losses avoided, recoveries, and operational gains.
- Treat insurance savings as a potential benefit, not an automatic result; distinguish documented premium effects from reduced exposure and liability.
- Build a credible business case around a small set of reliable measures, then expand the assessment as consistent baselines emerge.
- Include direct incident expenses alongside recovery demands, legal exposure, disruption, and damage to customer trust.
- Connect security priorities to stakeholder concerns and business objectives so budget decisions reflect the organization’s specific risk profile.
Can investing in a security system lower your insurance premiums and liability?
A security investment can reduce expected losses and support insurance discussions, but it does not automatically lower premiums or legal liability. To measure its return, compare documented costs with avoided losses, recoveries, and efficiency gains.
Cost Avoidance and Efficiency Gains
Security-system ROI compares investment costs with losses avoided and measurable efficiency gains. This matters because prevention often creates value through incidents or delays that never occur.
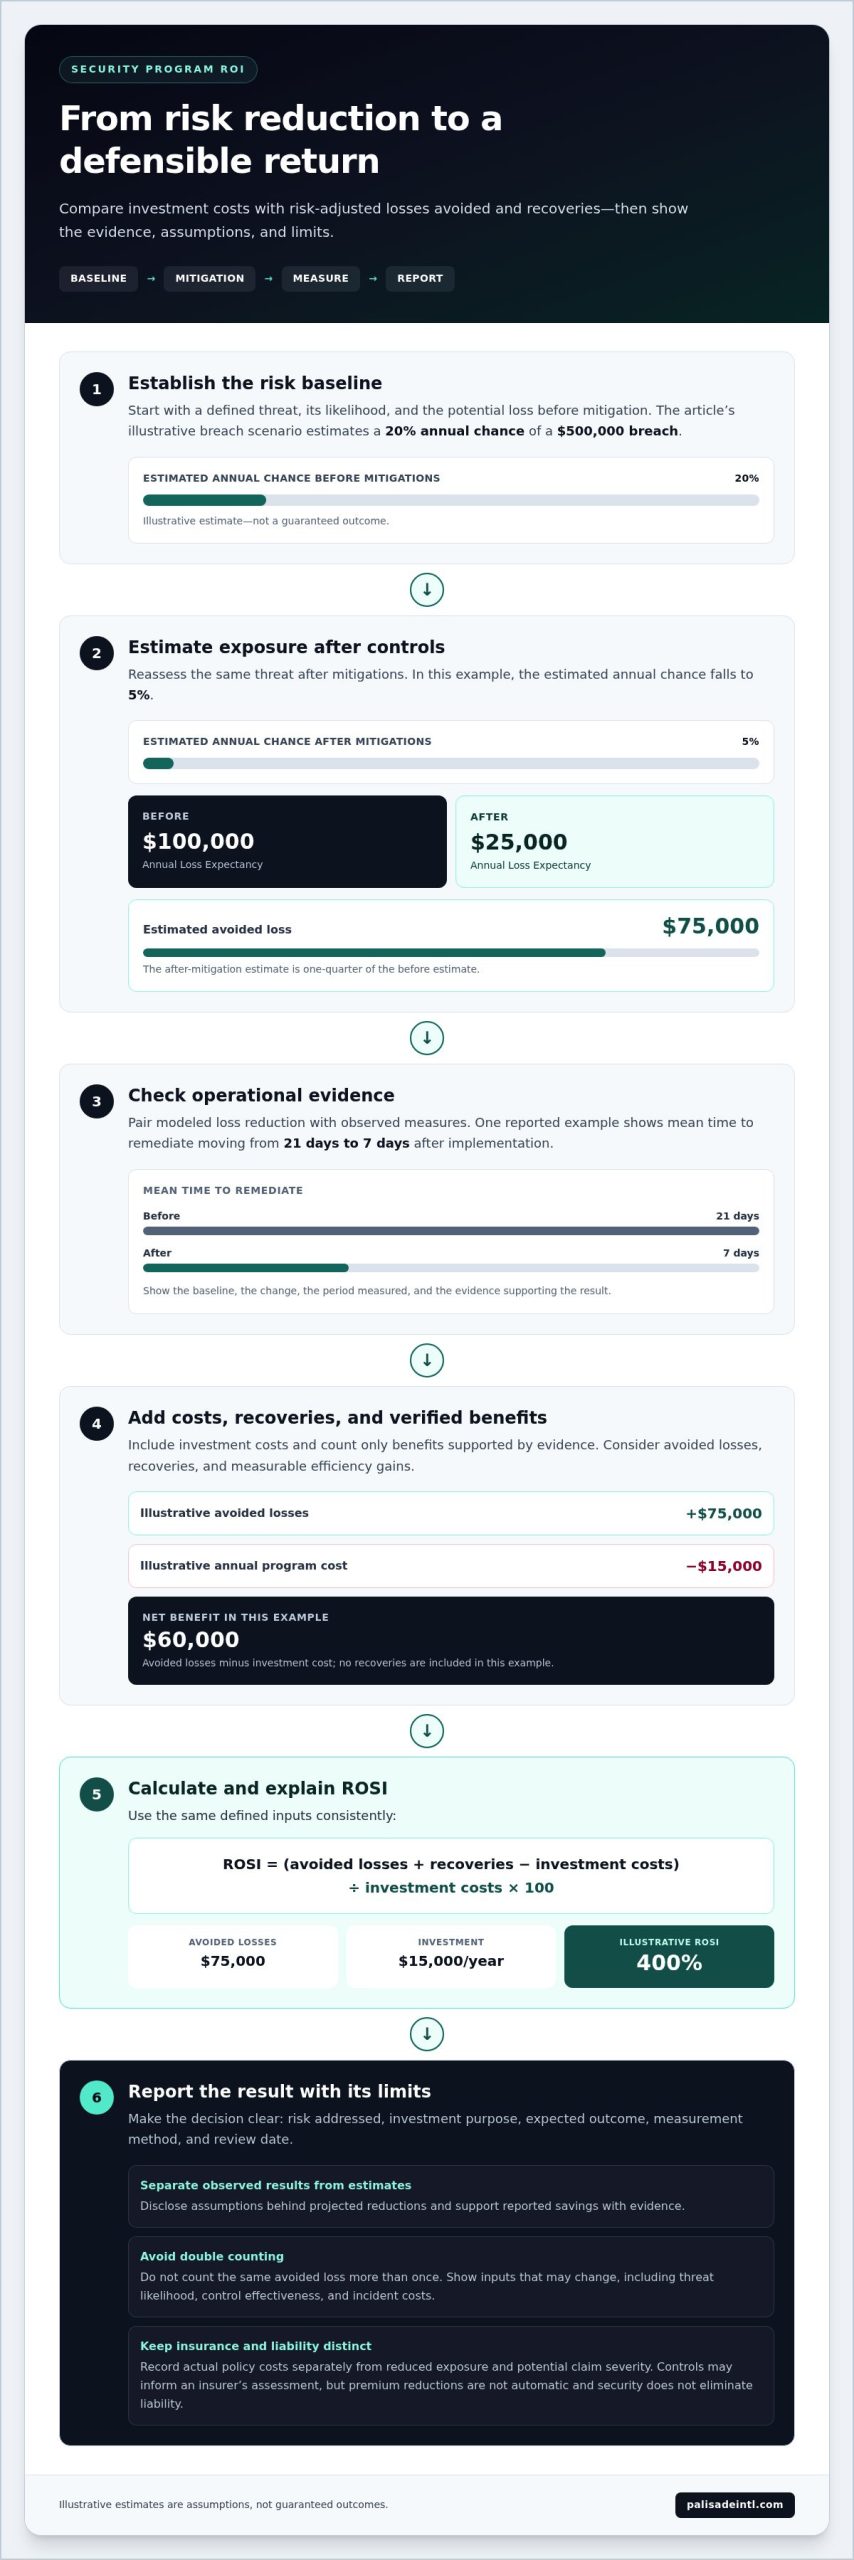
Threat modeling also makes risk reduction measurable: one example estimates a 20% annual chance of a $500,000 breach before mitigations, then a 5% chance afterward. Annual Loss Expectancy falls from $100,000 to $25,000, an estimated $75,000 in avoided losses. These are illustrative estimates, not guaranteed outcomes.
For insurance and liability, track controls, identified threats, remediation, and incident outcomes together. Evidence of controls can inform an insurer’s assessment, but it does not establish a premium reduction or eliminate liability. Record actual policy costs separately from reduced exposure and potential claim severity.
Reporting Security Cost Savings
Security cost reporting translates avoided rework, reduced incident costs, and faster response into comparable metrics. To demonstrate value, show the baseline, the change, the period measured, and the evidence supporting each estimate. A threat-modeling example reports mean time to remediate falling from 21 days to 7 days after implementation.
Measure early issue detection by comparing the hours spent on threat modeling with time saved through avoided redesign or rework. Record incident costs and recovery outcomes alongside productivity measures. This gives leaders practical insight into resilience while distinguishing observed savings from projected reductions in threats or liability.
Comparing Spending and Benefits
Industry benchmarks can provide context, but organizations often measure different things, making direct comparisons difficult. Establish an organization-specific baseline, then compare like-for-like metrics over time, such as remediation time, incident costs, or control effectiveness. When comparing security spending with industry benchmarks, use comparable measures where available and rely on consistent internal baselines when definitions differ.
How do you calculate security program costs and benefits? Add avoided losses and recoveries, subtract security investment costs, then divide net benefit by investment cost and multiply by 100. An illustrative threat-modeling program costing $15,000 per year reports $75,000 in avoided losses and a 400% ROSI.
How should you assess the limitations and risks of security ROI calculations? Treat probability-based estimates as assumptions, disclose the supporting evidence, and avoid counting the same avoided loss twice. Because a model can change when threat likelihood, control effectiveness, or incident costs change, report those inputs alongside the result.
Communicating security investments to budget decision-makers
Security leaders need to show how an investment supports organizational priorities, not just describe its controls. A concise executive case connects a critical threat to its potential business impact, the proposed response, and a measurable outcome. This is especially useful when no noteworthy incident has occurred, since prevention can otherwise appear financially invisible.
Build a decision-ready case
Begin with one reliable metric rather than presenting 15 measures without a consistent baseline. Choose an indicator tied to a business risk, such as incident cost, remediation time, or control effectiveness. Then explain its current level, the operational change being funded, and how the organization will assess progress. A defined baseline gives stakeholders a point of comparison.
Translate technical findings into consequences leaders can assess: disrupted operations, employee safety, customer confidence, or recovery demands. Separate observed results from estimates and show the assumptions behind projected reductions. For example, distinguish measured changes in response time from modeled losses avoided rather than combining them into one unqualified savings figure.
Training completion illustrates why a single metric can mislead. A 95% annual completion rate may look strong while employees still fall for phishing scams. Likewise, 100% completion does not mean an organization has a 0% chance of a breach. Pair completion data with evidence of employee behavior or threat detection to show whether training is improving readiness.
Use a balanced scorecard
A balanced scorecard presents security performance through complementary measures, rather than treating spending or activity as proof of effectiveness. Pair financial indicators, such as incident costs, with operational measures, such as time to detect, respond to, or contain threats. Add a control or compliance measure when it reflects a specific organizational priority.
For each measure, identify its owner, data source, reporting period, and connection to the funded initiative. Monthly or quarterly reviews can show whether progress is sustained or temporary. Keep the scorecard concise: stakeholders can interpret a few clearly defined indicators more readily than a dashboard combining unrelated figures.
Present the decision in a compact sequence: risk addressed, investment purpose, expected outcome, measurement method, and review date. That structure helps executives compare security with other proposals without implying that every benefit can be precisely monetized. If executive travel creates a distinct protection concern, executive protection planning can be considered as a focused operational measure.
Financial and reputational costs of security incidents
Security incidents create direct expenses and can also undermine customer trust and operational continuity. Compare cybersecurity and physical security by tracking the costs each is designed to reduce: breach response and data recovery for cyber risks, and asset replacement, disruption, or theft for physical risks.
Financial Costs of Breaches
The financial cost of a breach includes immediate response and recovery, as well as legal issues, regulatory fines, asset replacement, and lost business. Track these categories because the initial incident invoice rarely captures the full impact.
The worldwide average cost of a data breach was $4.44 million in 2025, down 9% from the prior year. The average in the United States reached $10.22 million that year, while healthcare organizations averaged $7.42 million. These figures offer context, not a forecast for an individual organization.
For ROI analysis, separate expenses by cause and timing. Record investigation, restoration, replacement, legal response, and interruption costs in distinct categories. Then compare incident history with the organization’s exposure and the controls intended to reduce it. A proactive effort has stronger financial evidence when it changes a relevant outcome, such as the ability to restore operations or contain an incident.
Reputational Costs of Incidents
Reputational costs arise when an incident reduces customer confidence, weakens retention, or delays future business. They matter because lost revenue can continue after technical recovery and may not appear in the immediate response budget.
The average cost of lost business due to a data breach was £2.2 million. Treat this as a separate impact category rather than adding it to direct response costs without checking for overlap. Track relevant indicators, such as customer departures, renewal changes, or delayed transactions, against a pre-incident baseline.
If a breach interrupts service, for example, document the affected operations, duration, and subsequent customer behavior. This evidence helps distinguish reputational effects from technical recovery expenses and shows whether security efforts protect the organization’s ability to serve customers consistently.
To compare cybersecurity and physical security ROI, use the same financial framework but select outcomes relevant to each risk. Cybersecurity analysis may measure breach-related recovery and business interruption; physical security analysis may examine theft, replacement, and operational disruption. Link each reduction to the control being assessed, and do not treat correlation alone as proof of causation.
Stakeholder feedback and business priorities
Security priorities gain support when leaders connect risk analysis to specific business objectives. Stakeholder feedback helps identify which operations, people, and assets need protection, while operational data shows how a proposed solution supports those priorities. For example, a continuity-focused investment should identify the business process it protects and the disruption it aims to limit.
Executive views can differ across functions. In one survey, 10% of C-suite leaders other than CISOs and CIOs expected cybersecurity team reductions, while 20% expected reductions in other areas. In the same survey, 87% of executives said security-team reductions would increase organizational risk. These findings illustrate why a business case should address both expenditure and the risk leaders associate with changing security resources.
What data is needed to measure security program ROI? Track investment costs, incident and recovery records, control effectiveness, operational disruption, and stakeholder priorities. Establish a baseline for each measure, identify its data owner, and connect each metric to a defined business outcome.
For organizations with multiple locations, assess each site against the same strategic criteria and record local differences. A central office and a remote facility may have different operating hours, assets, access patterns, and threat profiles. A site-by-site analysis can show whether a common control fits each location or needs tailored implementation. Compare results using consistent definitions, such as incident type, response time, and operational impact, so leaders can interpret differences accurately.
Business continuity adds another dimension to ROI. Map critical processes, dependencies, recovery procedures, and the operational consequences of interruption. Then assess how security controls support continuity, such as by preserving access to essential facilities or protecting sensitive business information. Record exercise findings and actual recovery performance separately: both provide evidence about readiness, but they reflect different conditions.
A data-driven business case should state the risk, proposed action, evidence, and review measure. Separate confirmed costs from estimated avoided losses, and explain how each estimate was derived. If a vulnerability assessment identifies an exposure at a location, for example, document the affected operation, recommended mitigation, and evidence used to evaluate progress. This makes the analysis traceable instead of relying on broad claims.
Review stakeholder input alongside performance data on a monthly or quarterly schedule. A finance leader may prioritize cost control, while an operations leader focuses on continuity and a site manager on local exposure. Recording these priorities helps explain how a security investment supports organizational objectives, even when its value cannot be reduced to a single financial metric.
Avoided losses, recoveries, and investment costs
A credible ROI calculation distinguishes losses prevented, assets or funds recovered, and the full cost of security. Measuring the ROI of corporate security programs means keeping these categories visible so decision-makers can evaluate savings without counting the same benefit twice.
Use a consistent formula: subtract security investment costs from avoided losses and recoveries, divide the result by investment costs, then multiply by 100. Include implementation and ongoing operating expenses in the cost base. Define the measurement period clearly, since a one-time recovery and recurring savings have different effects on annual results.
For example, a business that reduces annual employee-theft losses from $5,000 to $500 saves $4,500 per year. Record the reduction against the prior loss baseline, then include recoveries separately only when they represent additional value. This produces a stronger account of realized savings than treating every recovered item as a prevented loss.
Retail losses also show why the exposure matters. The National Retail Federation reported that retail shrink cost businesses over $100 billion in a recent year. That industry figure can frame the scale of the issue, but an individual company’s calculation should use its own loss records, asset exposure, and control results rather than applying the sector total to its budget case.
Early intervention can reduce future remediation effort. Fixing a vulnerability during the design phase can be 10 to 100 times cheaper than fixing it after deployment. To evaluate the benefit, document the issue, the stage when it was detected, the corrective work avoided, and the security investment supporting detection. A disciplined approach to measuring the ROI of corporate security programs relies on project evidence, rather than assuming every early finding prevents the same expense.
Include recoveries only when records show that security efforts contributed to retrieving property, funds, or other business assets. Record the recovery amount, timing, and costs required to secure it. Do not count recovered value as both a recovery and an avoided loss, which would inflate the return and undermine confidence in the analysis.
Finally, test whether the result remains strong under different assumptions about loss frequency, control effectiveness, and operating costs. Keep projected benefits separate from realized savings, and update the calculation as incident and recovery records change. A vulnerability assessment can help identify exposures and inform which risks merit investment, giving leaders a defined basis for comparing security costs with potential losses.
Palisade International: Executive Protection
Palisade International helps organizations assess and address security priorities through Executive Protection, Workplace Violence Prevention, Risk Analysis & Vulnerability Assessments, and Private Investigations. Executive Protection may suit situations where leaders or other personnel face risks related to travel, public visibility, or sensitive business activity. Risk Analysis & Vulnerability Assessments can clarify exposure and guide decisions about measures that align with operational priorities. Evaluate these services against the risks addressed, the outcomes tracked, and wider business priorities. To discuss a tailored approach to protection and risk mitigation, contact Palisade International.
Turn Security Insight Into a Deliberate Next Step
Make security performance part of ongoing business governance. Assign an owner to each priority, set a schedule for leadership reviews, and revisit assumptions as operations or exposure change. This keeps measuring the ROI of corporate security programs connected to decisions, rather than treating the calculation as a one-time budget exercise. A disciplined review also helps identify when a control no longer aligns with the organization’s strategic needs.
Where people, workplaces, or organizational vulnerabilities require focused attention, Palisade International offers Executive Protection, Workplace Violence Prevention, and Risk Analysis & Vulnerability Assessments. These offerings can support a security approach shaped around the risks and priorities identified in your analysis. Contact Palisade International to discuss a suitable next step. A clear assessment can help your organization move forward with greater purpose and confidence.
Frequently Asked Questions
How much can you save by reducing theft, vandalism, and unauthorized access?
Savings depend on recorded losses, exposed assets, and control effectiveness. Separate theft, vandalism, and unauthorized-access incidents in the loss register, then compare each category before and after a control change. Where records support it, include repair, replacement, investigation, and operational disruption costs. For example, a site can track unauthorized-entry events and related damage, then assess whether access changes reduced their frequency and consequences.
What does “ROI” really mean for a business security system?
ROI shows whether a security investment produced business value relative to its cost. Value may include avoided losses, recovered assets, improved operational efficiency, or documented insurance effects. For example, compare a system’s total ownership costs with verified changes in theft losses and time spent investigating incidents. Keep measured outcomes distinct from projected benefits so decision-makers can see which gains occurred and which remain estimates.
What is a realistic payback period for commercial security upgrades?
A payback period depends on investment cost and the annual savings attributable to the upgrade. An illustrative calculation uses a $10,000 security-system investment and $6,700 in estimated annual savings, producing a stated payback period of 1.5 years, or 18 months. The example also includes an annual insurance discount and efficiency gains. Use your own documented savings and costs to assess whether a similar timeline fits your business.
How do you define ROI for a corporate security program?
Define corporate security ROI as the relationship between program costs and the business value delivered. Include direct spending, internal staff time, and ongoing operating costs, then assess realized savings, recoveries, and measurable operational benefits. When reviewing an access-control initiative, for example, distinguish deployment costs from verified changes in unauthorized entry or incident response. State the measurement period and assumptions alongside the result.
What metrics measure corporate security program effectiveness?
Useful metrics depend on the threats and outcomes the program is designed to address. Organizations can track incident frequency and cost, mean time to detect, mean time to respond, mean time to contain, and remediation time. For a workplace safety initiative, add relevant incident reports and completion of corrective actions. Pair each metric with a baseline and a clearly identified data owner, then review results consistently to find changes that matter operationally.
How can organizations quantify avoided losses from security incidents?
Estimate avoided losses by comparing a defined risk scenario before and after a control, using documented assumptions about likelihood, impact, and control performance. For example, record the potential cost of a business interruption, then use exercise findings or incident records to assess how response improvements changed exposure. Keep modeled avoidance separate from actual recoveries and realized savings. This distinction makes estimates easier to scrutinize and reduces double-counting.
How do compliance requirements and cyber insurance affect security ROI?
Compliance work can add value by helping an organization identify and address control gaps, while cyber insurance terms can affect the financial assessment of risk. The European Union’s GDPR mandates security measures to protect sensitive data. Track resources used to meet applicable obligations separately from other security spending. For insurance, document actual premium effects and policy terms as distinct inputs: control improvements alone do not establish a premium reduction.
How can companies present security ROI to executives and boards?
Present a concise business case linking a specific risk to an investment, measurable outcome, and accountable owner. A board briefing might show the affected operation, evidence behind the risk estimate, planned control, and review measure. Separate actual results from forecasts and state key assumptions plainly. This format helps executives compare the proposal with other strategic priorities without relying on technical detail or overstated savings.